For Sale

438 Rickard Road, Clarington, Ontario L1C 3K5

$4,999,999

438 Rickard Road, Clarington, Ontario L1C 3K5 is For Sale and has a listing price of 4,999,999. The property is located in the Clarington . It's been on the website for 100 Days.

  • Land
    Property Type
  • MLS ID: E11885731
  • Office Name ROYAL SERVICE REAL ESTATE INC.
Property Description

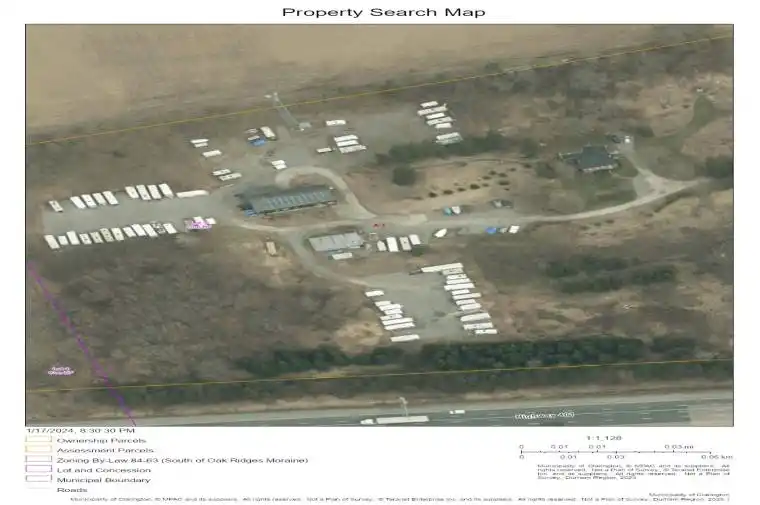
These 20.6 acres are designated “Employment Lands” in the Region of Durham 2023 Official Plan, as ratified by the Province of Ontario on Sept 3, 2024. The property has 1,273 feet frontage on north side of Highway 401 immediately west of Highway 35/115 Interchange. This location provides easy access toHwy 2, Hwy 401 & Hwy 35/115. Well maintained farmhouse (duplex) and outbuildings (see photos). MPAC Assessment states “Code 221 – Farm with residence – with commercial/industrial operation”. The property has many streams of income, to the potential of $160-180k per year for the new owner/operator: a) long term lease with communication tower company, b) well established recreational vehicle storage business (since 1996 – see aerial views), c) municipal certified legal non-conforming residential duplex-farmhouse, d) 12 KVW Micro Fit Producer. Buyer responsible for completing own due diligence. See MLS Listing for additional files. Seller will consider VTB.

Property Details
  • MLS ID: E11885731
  • Price: $4,999,999
  • Lot Depth: 1325
  • Transaction Types: For Sale
  • Ref ID: E11885731
  • Year Built: N/A
  • Dir / Cross St: Exit Hwy 401 at Bennett Rd, go 3/4 Km north to Hwy 2, go 3/4 Km east to Rickard Road, go south to property .
  • Status: Active
  • Tax Year: 2023
  • Property Type: Land
  • Property Type: Commercial
  • Property Sub Category: Vacant land
Price History
List Date MLS ID List Price Status End Date Closed Price
12/08/2024 E11885731 $4,999,999 For Sale - -
Market Temperature
  • Buyer's Market
  • Balanced
  • Seller's Market
Neighborhood Stats
Clarington
  • $1,437,468 Average List Price
    based on 1 year
  • 6 New Listings
    based on 30 days
  • 77 Median Days on Market
    based on 1 year
  • List vs. Selling Price 263.97 % Up
  • Sold (12mo) 87
  • Rented (12mo) 79

  • 1 Month Change -100.0%
  • 3 Month Change -100.0%
  • 6 Month Change -100.0%
Walkscore
Property Type Distribution
  • All Houses
    80.28%
  • All Houses/Commercial
    0.01%
  • Commercial
    7.34%
  • Condo
    11.75%
  • Land for Sale
    0.61%
Additional Details
  • Taxes: $3,282
  • Last Status Y
  • Original Price: $0
  • Sold Price: $0
  • Addl Monthly Fees: $0
  • Possession Remarks: T B A
  • Listing Entry Date: 08/12/2024 15:11:23
Want to see this property?